

Understanding how to read crypto charts is one of the most powerful skills you can develop as a beginner in the world of cryptocurrencies. Charts help you visualize price movements, identify patterns, and make informed decisions rather than relying on guesswork or hype.
Let’s explore the basics of reading crypto charts and spotting trends — without overwhelming technical jargon.
1. Why Crypto Charts Matter
Crypto markets are fast-moving and often volatile. Charts offer a visual representation of price behavior over time, helping traders and investors:
- Identify entry and exit points
- Recognize bullish or bearish trends
- Analyze market sentiment and volatility
Whether you’re trading or holding, reading charts gives you a clearer understanding of what’s happening in the market.
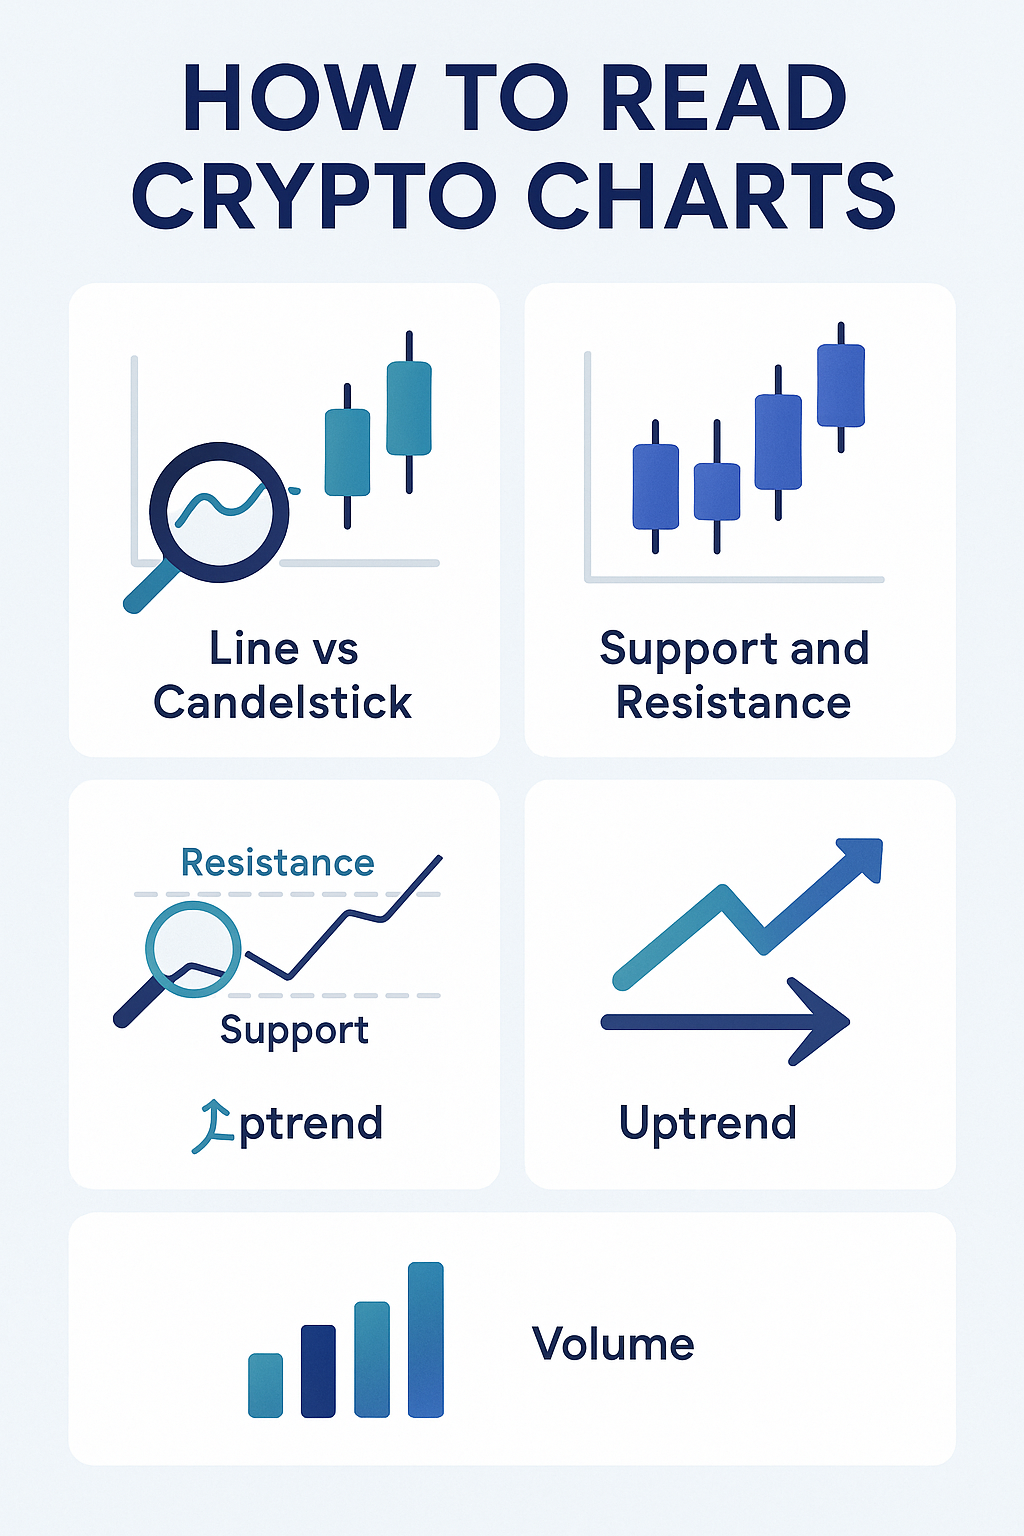
2. Types of Crypto Charts
Line Chart
- Simplest form of chart
- Plots closing prices over time
- Great for spotting general trends
Candlestick Chart (Most Common)
- Each candle shows open, high, low, and close prices (OHLC)
- Green/white candles = price went up
- Red/black candles = price went down
- Useful for identifying patterns and reversals
Bar Chart
- Similar to candlesticks but less visual
- Also shows OHLC
For most beginners, candlestick charts are the best starting point.
3. Key Elements to Understand
Trend
- Uptrend = Higher highs and higher lows (bullish)
- Downtrend = Lower highs and lower lows (bearish)
- Sideways trend = Consolidation or indecision
Support and Resistance
- Support: A price level where demand tends to prevent the price from falling lower
- Resistance: A level where selling pressure prevents price from going higher
- Important for spotting potential breakout or reversal zones
Volume
- Measures how much of the asset is being traded
- High volume = stronger signals
- Low volume = weak or false signals
4. Common Patterns to Recognize
While advanced pattern reading takes time, here are some basics:
- Double Top/Bottom: Possible trend reversal
- Head and Shoulders: Often signals a reversal
- Triangles: Indicate consolidation before a breakout
These patterns become easier to spot with practice.
5. Simple Tips for Beginners
- Stick to daily charts when starting out
- Use chart tools like TradingView for free access
- Don’t overanalyze — focus on clear patterns
- Combine charts with fundamental news for better decisions
- Avoid emotional trading based on short-term moves
Final Thoughts
Reading crypto charts doesn’t have to be intimidating. Start with the basics, get comfortable recognizing trends and levels, and over time you’ll build the confidence to analyze more complex setups.
👉 Want to master crypto charts and technical analysis step by step? Click here to explore a beginner-friendly course that teaches chart reading and trend spotting
Leave a Reply